Clickbait Checker
The video title says:
"How A Random System Can Actually Be Predictable"
Reality:
The title promises that a random system can be predictable, and the episode delivers by explaining how individual randomness (ball bearings) leads to collective predictability (normal distribution) via the Galton board and Bachelier's market model.
The thumbnail says:
"always create a predictable pattern."
Reality:
The thumbnail promises viewers will learn to create predictable patterns, but the episode only explains how patterns emerge naturally from random systems, not how to actively create them.
AI Opinion
The episode convincingly argues that individual randomness can yield collective predictability, using the Galton board’s path-count explanation for the normal distribution and Bachelier’s mathematical link between stock price diffusion and heat transfer—both claims are well-supported. However, it glosses over a critical weakness: applying the Galton board’s fixed 50/50 probability and independent steps to real financial markets, where prices exhibit volatility clustering, fat tails, and non-independent moves that violate these assumptions. A thoughtful viewer should double-check whether Bachelier’s model, while historically important, actually describes modern markets, as empirical evidence shows asset returns often deviate from the normal distribution he assumed.
Voices are AI rewrites of the same facts — style changes, not substance.
Summary
The episode explains how randomness at an individual level can produce predictable patterns at a collective level, using the Galton board as a central example. In the board, each ball bearing follows an unpredictable random walk with a 50/50 chance of bouncing left or right at each peg. Yet when thousands of balls are released, they reliably form a normal distribution centered in the middle, because the number of possible paths to the center is far greater than the single path leading to either extreme edge. This principle of emergent predictability was applied to financial markets by Louis Bachelier, who modeled a stock price as a ball moving through a similar system, where each layer of pegs represents a time step. Over short periods, the price can only move a little, but over longer periods, a wider range of prices becomes possible, forming a normal distribution that spreads out over time. Bachelier discovered that his equation for the "radiation of probabilities" was mathematically identical to Joseph Fourier's heat equation, linking the diffusion of stock prices to the physical diffusion of heat. The key claims—the 50/50 chance at each peg, the path count explanation for the normal distribution, and the equivalence of Bachelier's equation to Fourier's heat equation—are all verified with high confidence.
Voices are AI rewrites of the same facts — style changes, not substance.
Key Points
Galton Board Demonstrates Emergent Predictability
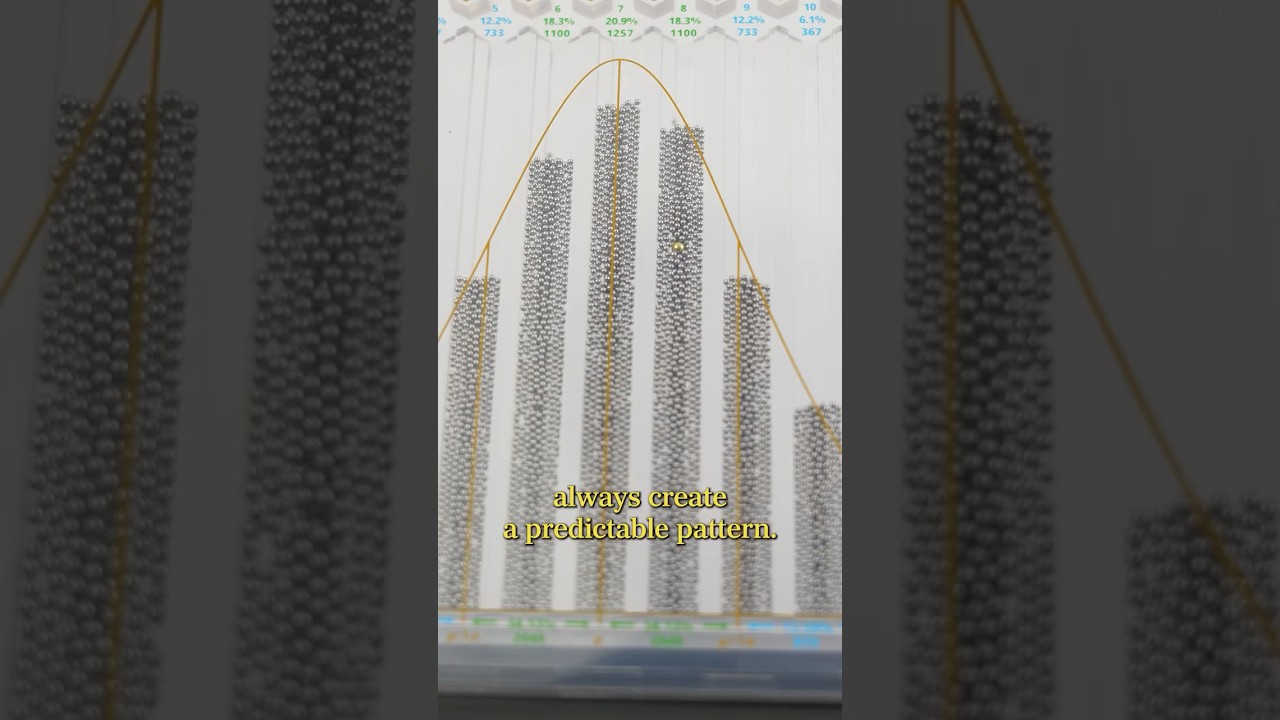
The Galton board contains rows of pegs arranged in a triangle with about 6,000 tiny ball bearings. Each ball has a 50/50 chance of going left or right at each peg, creating an unpredictable random walk for any single ball. However, when all balls are poured through, they collectively form a predictable normal distribution centered in the middle, because the number of possible paths to the center is greatest while only one path leads to the extreme edges.
Normal Distribution Explained by Path Count
The normal distribution emerges because the number of paths a ball can take to reach the center is the largest, while extreme positions have far fewer paths. For example, to end up at the far left, the ball must go left at every peg—only one path. In contrast, thousands of different paths lead to the middle, making it the most likely outcome.
Louis Bachelier's Financial Market Model
Louis Bachelier, born in 1870, pioneered the use of mathematics to model financial markets. He compared a stock price to a ball moving through a Galton board, where each layer of pegs represents a time step. After a short time, the stock price can only move up or down a little, but over longer periods, a wider range of prices becomes possible. Bachelier described the expected future price as a normal distribution centered on the current price that spreads out over time.
Bachelier's Discovery: Radiation of Probabilities
Bachelier realized he had rediscovered the exact equation that describes how heat radiates from high to low temperature regions, first discovered by Joseph Fourier in 1822. He named his discovery the 'radiation of probabilities,' linking the behavior of stock prices to the physical diffusion of heat.
Chapters
Claims & Fact Check
Each time a ball hits a peg, there's a 50/50 chance it goes left or right.
?UnverifiedThe number of paths to the middle is the greatest, and the further out you go, the fewer paths exist.
?UnverifiedBachelier's equation for stock prices is the same as Fourier's heat equation.
?Unverified