
Clickbait Checker
The video title says:
"The Scariest Chart in Electrical Engineering"
Reality:
The title 'The Scariest Chart in Electrical Engineering' accurately reflects the episode's focus on demystifying the intimidating Smith Chart, which is indeed notorious among students.
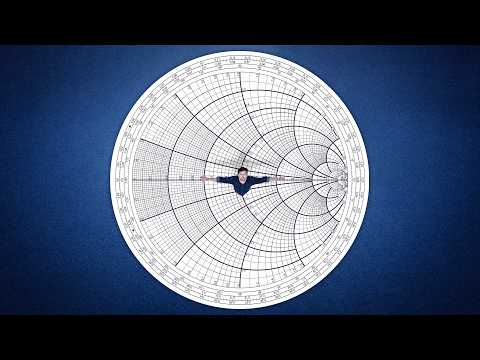
The thumbnail says:
"Black Magic"
Reality:
The thumbnail's 'Black Magic' hook and mystical imagery are overstated, as the episode is a straightforward technical explanation of the Smith Chart, not an exploration of supernatural secrets.
AI Opinion
The episode convincingly argues that the Smith Chart is a powerful, elegant tool for solving impedance-matching problems graphically, particularly by demonstrating how a precisely trimmed stub can eliminate reflections without wasting power as heat. However, its claim that the chart "puts the fear of God into all undergraduate students" is a broad generalization that may not hold for every student or curriculum, and the demonstration's success is presented as a single, controlled example rather than a rigorous proof of the chart's universal applicability. A thoughtful viewer should verify the underlying physics of wave reflection and impedance matching from a standard textbook, and consider that while the chart's principles are sound, modern software often automates these calculations, meaning hands-on proficiency with the chart may be less critical than understanding the concepts it represents.
Voices are AI rewrites of the same facts — style changes, not substance.
Summary
The episode demystifies the Smith Chart, a tool notorious among electrical engineering students for its intimidating appearance, by tracing its origins and practical function. Developed independently by Philip Smith at Bell Labs, Tōsaku Mizuhashi in Japan, and Amiel Volpert in the Soviet Union during the late 1930s, the chart solved a critical problem in long-distance radio transmission: power loss caused by impedance mismatches and signal reflections on transmission lines. The video explains that reflections occur in AC circuits when the load (e.g., an antenna) does not match the characteristic impedance of the line, and that simply adding a resistor wastes power as heat. Instead, engineers use the Smith Chart to graphically find a point along the line where the real part of the impedance matches the source, then cancel the reactive component with a lossless element like a stub—a short length of transmission line cut to a precise length. A demonstration shows how trimming a coaxial stub to 77 mm eliminates reflections, achieving optimal power transfer. The chart’s ability to represent infinite impedance within a finite circle and its normalization for different system impedances make it a universal, practical tool that remains embedded in modern RF software.
Voices are AI rewrites of the same facts — style changes, not substance.
Key Points
The Smith Chart's Mysterious Reputation
The Smith Chart is famously intimidating to electrical engineering students, often described as 'terrifying' and 'black magic.' Despite this, it is widely used—millions of copies have been printed and it is embedded in modern software—because it solves a paradoxical problem in power transfer. The chart's ability to represent infinite impedance within a finite circle is one of its most puzzling features.
Philip Smith's Work at Bell Labs
In 1928, Philip H. Smith began working at Bell Labs on a project to send radio signals across the Atlantic using a directional array of over 20 antennas connected by more than two kilometers of transmission line. The goal was to focus the beam to about 10 degrees, increasing power in that direction by 400 times. However, Smith discovered that reflections along the line caused significant power loss, preventing the signal from reaching the antenna efficiently.
Reflections in AC Transmission Lines
Smith observed that when sending a signal from the source to the antenna, part of the wave bounced back due to impedance mismatches, reducing the power that reached the antenna. This reflection problem is specific to alternating current (AC), where voltage and current oscillate as sine waves. In contrast, direct current (DC) flows steadily without such reflections. Minimizing these reflections was critical for long-distance radio transmission.
Wave Properties: Wavelength and Frequency
Using a slinky analogy, the video explains that waves have a consistent wavelength (distance between peaks) and frequency (peaks per second). The speed of the wave equals wavelength times frequency. For electromagnetic waves in a vacuum, speed is constant at about 300 million meters per second, but in a transmission line it is slower. When the wavelength is long compared to the line length, reflections cause minimal distortion; but when the wavelength is short, reflections significantly alter the signal shape, leading to power loss.
Impedance Matching Without Resistors
Impedance is defined as the ratio of voltage to current in AC circuits, with magnitude indicating wave size and angle indicating phase shift. To match a load like an antenna (e.g., 10-j30 ohms) to a 50-ohm transmission line, you cannot simply add a resistor because it wastes power as heat. Instead, reflections cause impedance to vary along the line, so you can find a point where the real part matches 50 ohms and then cancel the imaginary part with a lossless inductor or capacitor.
Historical Context and Global Competition
In the 1930s, as political tensions rose, clear long-distance signal transmission became strategically important for coordinating ships, aircraft, and supply networks. Oliver Heaviside had earlier described transmission line behavior with equations, but using them to eliminate reflections was tedious with slide rules. Independently, Philip Smith in the US, Amiel Volpert in the Soviet Union, and Tōsaku Mizuhashi in Japan all sought a simple graphical system for quick impedance matching.
Smith Chart Design Begins
Philip Smith started designing a chart based on the complex plane but with a key modification to handle different characteristic impedances (e.g., 50 ohms vs. 75 ohms). If raw impedance values were plotted directly, each system would require its own chart with a different target, so Smith needed a normalized approach to make the chart universal.
Stub Matching Demonstration
The team successfully demonstrates impedance matching using a stub—a shorted or open-circuited length of transmission line. By trimming a coaxial cable stub to a precise length (77 mm or 92 mm), they cancel the reactive component of the load impedance, achieving optimal power transfer and eliminating reflections. The process involves starting at the open circuit position on the Smith Chart, walking around the constant reflection coefficient circle to the desired reactance, and converting the angular distance into a physical stub length.
Smith Chart as a Practical Tool
The Smith Chart graphically represents the entire impedance matching problem, enabling radio engineers to solve it without complex calculations. It was independently developed by Phillip Smith (1937), Mizuhashi in Japan (1937), and Volpert in the Soviet Union (1939). The chart's outer circle corresponds to a reflection coefficient magnitude of one (open or short circuit), and moving along the line corresponds to traveling around the chart, with one full lap equaling half a wavelength.
Stub as a Reactive Element
By adding a short or open circuit stub of appropriate length, engineers can synthesize any reactance value, replacing discrete inductors or capacitors. The stub acts like a cove off a river: the wave reflects off the open end, and the stub's length sets the timing of the returning wave. This allows cancellation of the imaginary part of the load impedance, as demonstrated by trimming a 92 mm stub down to 77 mm to achieve a match.
Series vs. Parallel Stubs and Admittance Chart
The series stub configuration shown is educational but impractical because it requires cutting the main transmission line. In practice, parallel (shunt) stubs are preferred, but parallel impedances do not add linearly—admittance does. Engineers use the Admittance Smith Chart (a flipped version) to easily design parallel stubs. The team notes that the stub is made of the same cable it is fixing, and the process mirrors what RF engineers do daily.
Chapters
Claims & Fact Check
The Smith Chart is the scariest chart in electrical engineering and puts the fear of God into all undergraduate students.
?UnverifiedWith two antennas, the waves combine; in some directions they cancel, in others they reinforce, and in the middle the power doubles.
?UnverifiedSmith's team connected more than 20 smaller antennas into a massive directional array linked by over two kilometers of transmission line.
?UnverifiedAdding a resistor to match impedance loses power through heat, which is the opposite of what you want.
?UnverifiedIn the 1930s, the ability to send clear signals across oceans became strategically important for coordinating military activities.
?UnverifiedPhilip Smith, Amiel Volpert, and Tōsaku Mizuhashi all independently worked on the same problem of creating a simple graphical system for impedance matching.
?UnverifiedThe Smith Chart was independently invented by Smith, Mizuhashi, and Volpert in the late 1930s.
?UnverifiedOne full lap around the Smith Chart corresponds to half a wavelength on the transmission line.
?UnverifiedBy trimming a stub to the right length, we stopped every reflection on this line with just a break in the circuit.
?Unverified